 ar
ar bg
bg hr
hr cs
cs da
da nl
nl fi
fi fr
fr de
de el
el hi
hi it
it ko
ko no
no pl
pl pt
pt ro
ro ru
ru es
es sv
sv tl
tl iw
iw id
id lv
lv lt
lt sr
sr sk
sk sl
sl uk
uk vi
vi et
et hu
hu th
th tr
tr fa
fa ms
ms hy
hy ka
ka ur
ur bn
bn mn
mn ta
ta kk
kk uz
uz ku
ku
Structural Health Monitoring Sensors
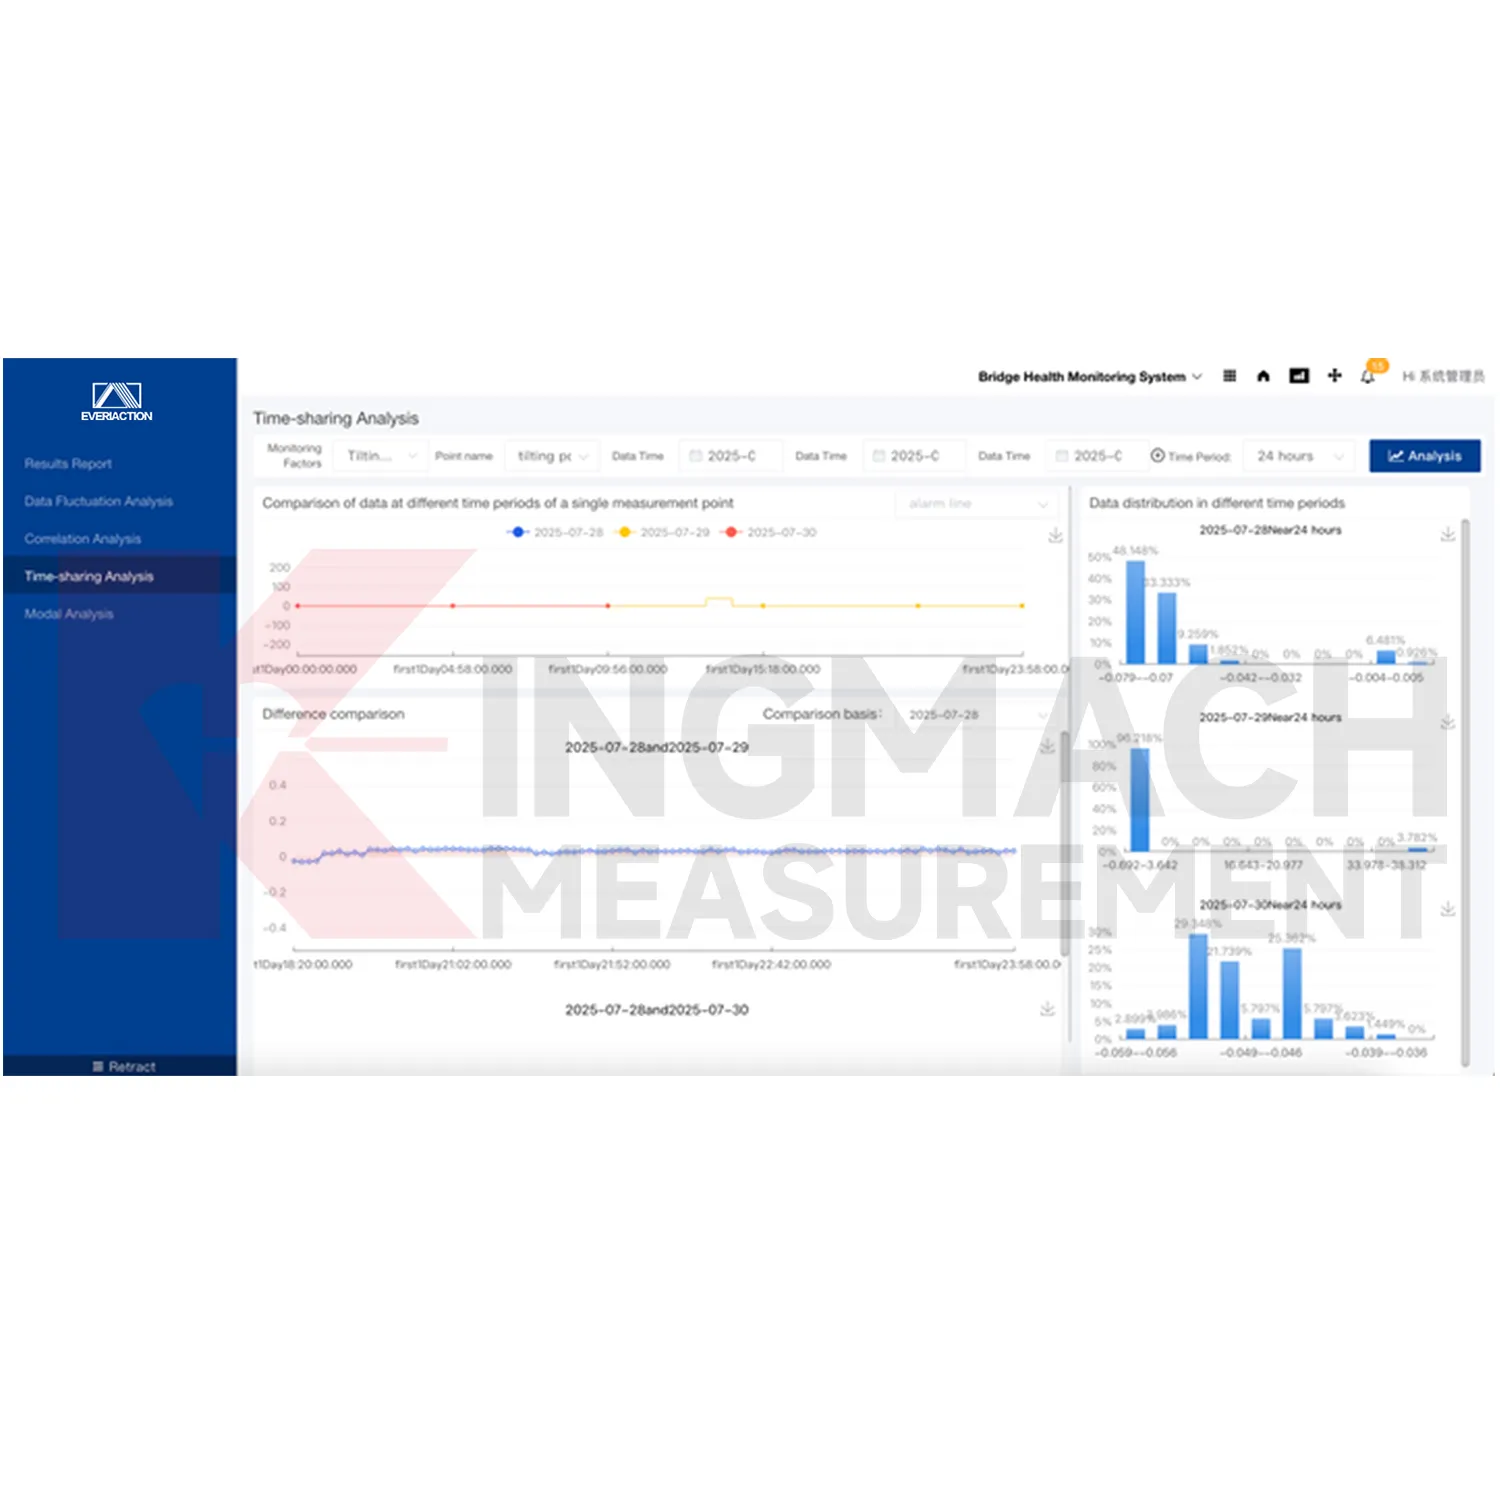
The platform supports graphical display so complex monitoring data can be converted into clearer visual information. Users can review trends, abnormal early warnings, and reports through a more intuitive interface. This is important because a raw table of readings is rarely enough for quick engineering management. Graphs, alarm status, project documents, and maintenance notes help users see what has changed and what needs attention. Kingmach Structural Health Monitoring Sensors is therefore positioned as a digital management layer above the field instruments.
Application of Structural Health Monitoring Sensors
Foundation pit monitoring uses Kingmach Structural Health Monitoring Sensors to coordinate support force, displacement, settlement, groundwater, tilt, and environmental records during construction. Pit sites change quickly, and data must be reviewed alongside excavation stage, support installation, rainfall, pumping, and nearby building response. Flexible alarm rules help the team distinguish routine stage-related movement from a reading that needs inspection. Project documents and dynamic information also help later reviewers understand what was happening when a trend changed.
The future of Structural Health Monitoring Sensors
Future use of Kingmach Structural Health Monitoring Sensors will grow as civil engineering monitoring moves from isolated instrument readings to connected asset management. More structures will rely on sensors, acquisition modules, wireless devices, and cloud platforms to maintain a continuous safety record. The software layer will become the place where owners review not just one reading, but the relationship between trends, alarms, inspections, weather, construction, and maintenance work. A platform that integrates multiple data sources will be central to that shift.
Care & Maintenance of Structural Health Monitoring Sensors
Dashboard maintenance for Kingmach Structural Health Monitoring Sensors should follow the needs of users, not just the number of available widgets. Operators need quick status, active alarms, and recent data quality. Engineers may need trend comparison, related channels, statistics, and event notes. Managers may need report summaries and project status. Review dashboard layouts after real use begins, then remove clutter and add views that help decisions. A clean visual layout keeps important changes easier to notice.
Kingmach Structural Health Monitoring Sensors
Kingmach Structural Health Monitoring Sensors turns scattered field readings into a project view that engineers, owners, and maintenance teams can actually use. A monitoring site may include strain gauges, load cells, displacement meters, settlement sensors, tiltmeters, water-level instruments, environmental sensors, accelerometers, acquisition modules, and data loggers. Without a central platform, each channel can become a separate file or screen. The Monitoring system software platform receives and stores multi-dimensional monitoring data in real time, then presents trends, alarms, reports, and project records in a clearer form. This helps users understand the status of bridges, tunnels, slopes, buildings, dams, subgrades, and foundation pits before small changes become difficult to trace.
FAQ
Q: What is Kingmach Structural Health Monitoring Sensors?
A: It is the Monitoring system software platform, also described as the Cloud Platform, for data integration, analysis, visualization, alarms, reporting, and project management.
Q: What technologies does it use?
A: The platform is based on Internet of Things, big data, and cloud computing technologies.
Q: What does the platform monitor?
A: It supports all-round monitoring of civil engineering structure safety across assets such as bridges, tunnels, slopes, dams, buildings, and foundation pits.
Q: Can it connect different devices?
A: Yes. The local product file says it can access hardware devices from different manufacturers, types, and models.
Q: How do devices send data?
A: Devices can transmit data to the Cloud Platform through wired or wireless means.
Reviews
Michael Anderson
The strain gauges and load cells are extremely accurate and stable. They performed very well in our bridge monitoring project. Highly recommended!
Daniel Brown
Excellent environmental monitoring sensors. The data is consistent, and the system integrates smoothly with our existing setup.
Latest Inquiries
To protect the privacy of our buyers, only public service email domains like Gmail, Yahoo, and MSN will be displayed. Additionally, only a limited portion of the inquiry content will be shown.
Ava***@gmail.comAustralia
Hi, I am looking for reliable tiltmeters and accelerometers for structural health monitoring. Please...
Amelia***@gmail.comSingapore
Hello, I am looking for visualization software for monitoring system data analysis. Please let me kn...
Related product categories
- Monitoring system software platform
- Environmental Monitoring
- Visualization Software
- GPS Displacement Monitoring System
- Integrated Monitoring Station
- Settlement Monitoring Rod
- Structural Health Monitoring (SHM) System
- Structural Monitoring Cloud Platform
- IoT Online Monitoring System
- Monitoring System Platform & Services
- Engineering Pulse Intelligent Monitoring Cloud Platform
- Construction Monitoring