 ar
ar bg
bg hr
hr cs
cs da
da nl
nl fi
fi fr
fr de
de el
el hi
hi it
it ko
ko no
no pl
pl pt
pt ro
ro ru
ru es
es sv
sv tl
tl iw
iw id
id lv
lv lt
lt sr
sr sk
sk sl
sl uk
uk vi
vi et
et hu
hu th
th tr
tr fa
fa ms
ms hy
hy ka
ka ur
ur bn
bn mn
mn ta
ta kk
kk uz
uz ku
ku
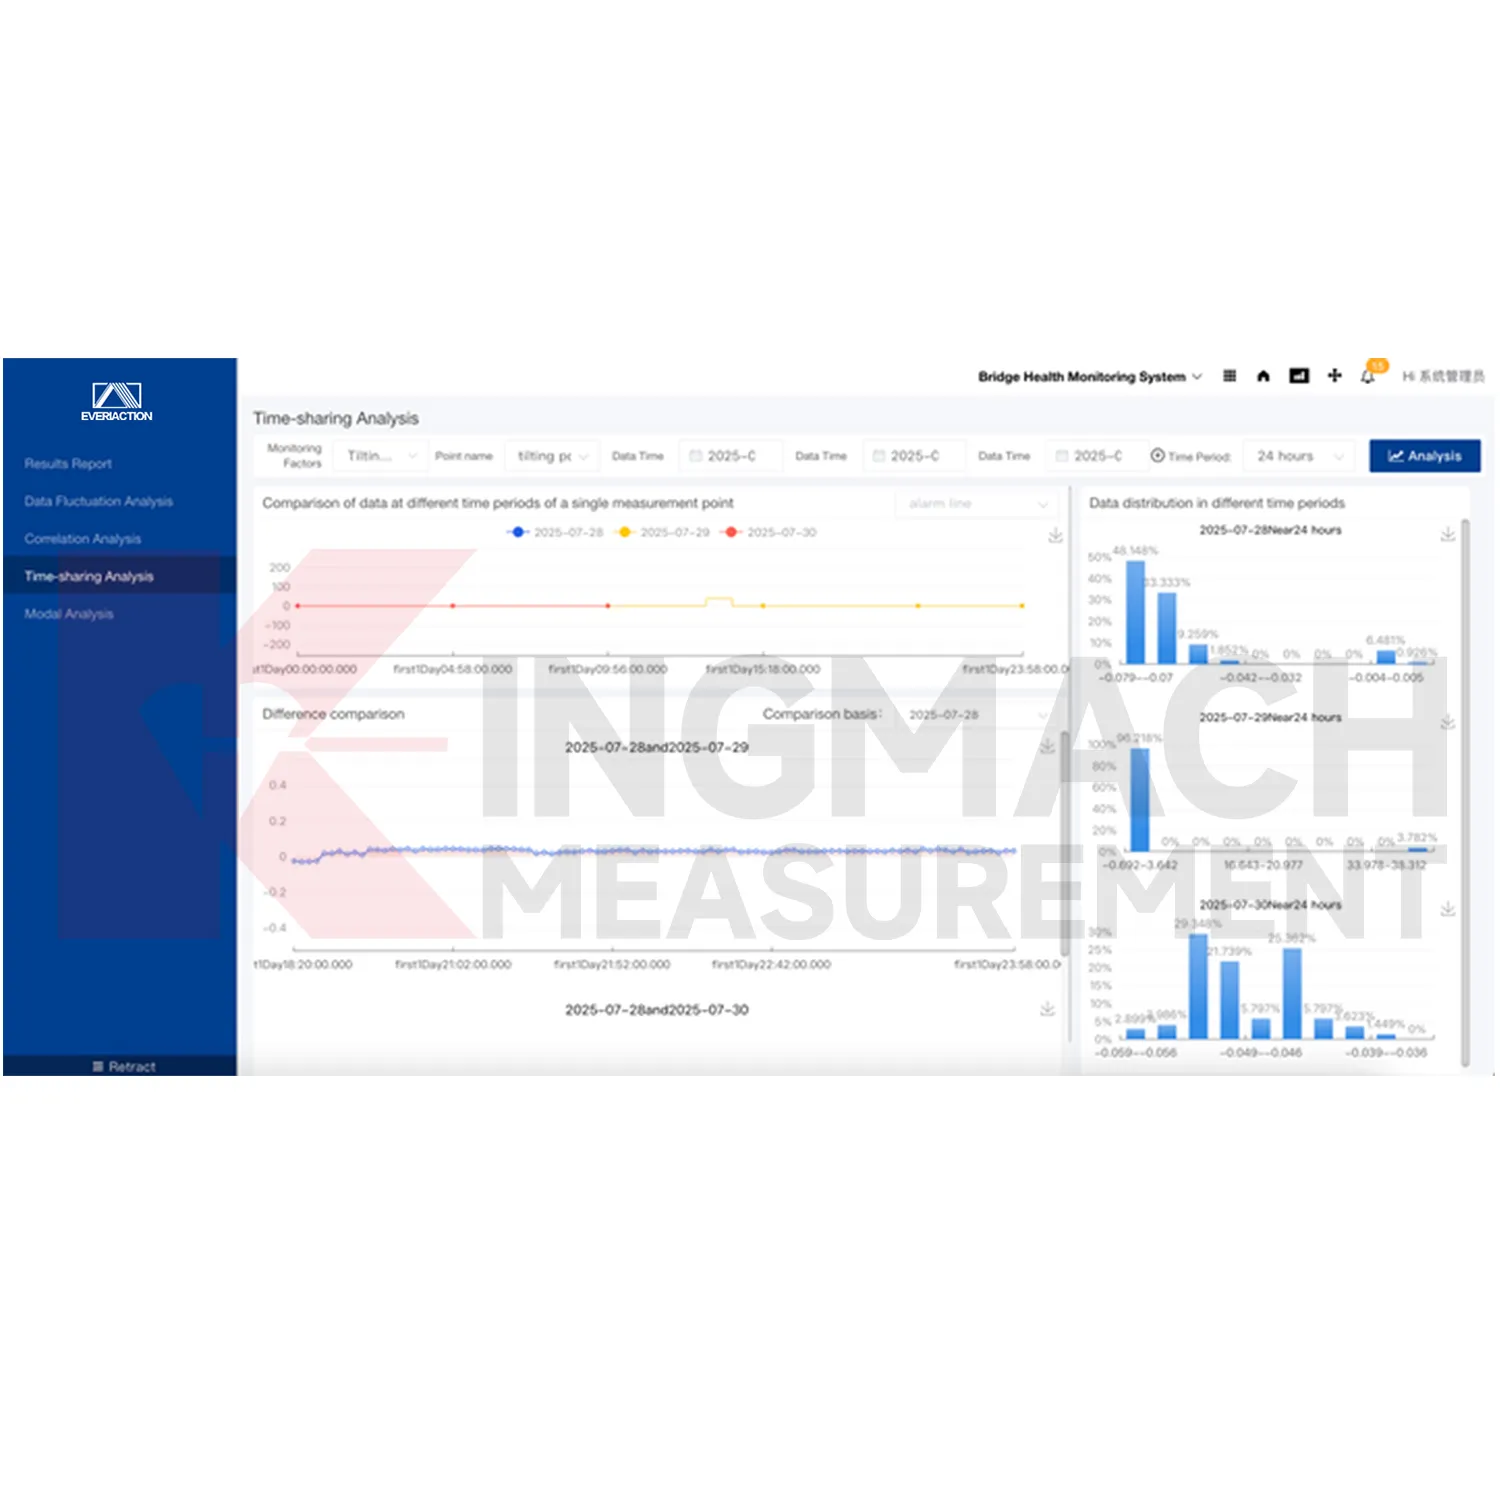
Visualization Software
After-sales and project support details in the local product file include efficient delivery for standard items when available, customized delivery per contract, warranty service for non-human-caused damage during the warranty period, and quick technical response. For a software platform, support matters because data integration, alarm configuration, report layout, user roles, and device access often need project-specific adjustment. Kingmach Visualization Software can therefore be planned as part of system deployment, not only as a display tool added after the sensors are installed.
Application of Visualization Software
Dam and hydraulic structure monitoring uses Kingmach Visualization Software to manage water level, seepage, deformation, settlement, temperature, pressure, and gallery inspection records. These assets require long-term data continuity and careful alarm handling. The platform can store multi-dimensional data, show trends, and maintain project documents around the same asset. When an abnormal pattern appears, reviewers can compare the value with water level, rainfall, maintenance notes, and related sensors before deciding the next field action.
The future of Visualization Software
Big data workflows will shape the future of Kingmach Visualization Software. Long-term structural monitoring creates large volumes of readings, alarms, inspection notes, and project documents. Raw storage alone is not enough; the platform must help filter, analyze, compare, visualize, and report those records. Over time, historical baselines will become more useful for judging whether a new event is ordinary, seasonal, construction-related, or abnormal. This makes data history an active part of engineering management.
Care & Maintenance of Visualization Software
When a project is handed over, Kingmach Visualization Software should include a clear operating package. The handover should cover project structure, device list, channel map, alarm rules, user accounts, report templates, backup method, maintenance records, and recent data quality notes. Training should show users how to read trends, respond to alarms, add documents, and export reports. A strong handover prevents the platform from becoming a passive screen and keeps it useful for daily structural safety management.
Kingmach Visualization Software
The core value of Kingmach Visualization Software is not only display. It supports fast storage, real-time filtering, efficient analysis, complex statistics, user-friendly display, and personalized customization of collected data. These functions help convert raw sensor streams into information that can be reviewed by engineers and maintenance teams. A single abnormal point may need trend comparison, related channel review, inspection notes, and alarm history before action is taken. The platform gives those elements a common place, reducing the risk that important context is lost across separate files or devices.
FAQ
Q: What is Kingmach Visualization Software?
A: It is the Monitoring system software platform, also described as the Cloud Platform, for data integration, analysis, visualization, alarms, reporting, and project management.
Q: What technologies does it use?
A: The platform is based on Internet of Things, big data, and cloud computing technologies.
Q: What does the platform monitor?
A: It supports all-round monitoring of civil engineering structure safety across assets such as bridges, tunnels, slopes, dams, buildings, and foundation pits.
Q: Can it connect different devices?
A: Yes. The local product file says it can access hardware devices from different manufacturers, types, and models.
Q: How do devices send data?
A: Devices can transmit data to the Cloud Platform through wired or wireless means.
Reviews
Andrew Lee
The visualization software is intuitive and powerful. It helps us analyze monitoring data efficiently.
Daniel Brown
Excellent environmental monitoring sensors. The data is consistent, and the system integrates smoothly with our existing setup.
Latest Inquiries
To protect the privacy of our buyers, only public service email domains like Gmail, Yahoo, and MSN will be displayed. Additionally, only a limited portion of the inquiry content will be shown.
Charlotte***@gmail.comUnited Arab Emirates
Hi, we require instrumentation cables suitable for harsh environments. Could you advise on specifica...
Olivia***@gmail.comUnited States
Hello, we are currently sourcing high-precision strain gauges and load cells for a bridge monitoring...
Related product categories
- Monitoring Software Suite
- Monitoring system software platform
- Environmental Monitoring
- Visualization Software
- GPS Displacement Monitoring System
- Integrated Monitoring Station
- Settlement Monitoring Rod
- Structural Health Monitoring (SHM) System
- Structural Monitoring Cloud Platform
- IoT Online Monitoring System
- Monitoring System Platform & Services
- Engineering Pulse Intelligent Monitoring Cloud Platform