 ar
ar bg
bg hr
hr cs
cs da
da nl
nl fi
fi fr
fr de
de el
el hi
hi it
it ko
ko no
no pl
pl pt
pt ro
ro ru
ru es
es sv
sv tl
tl iw
iw id
id lv
lv lt
lt sr
sr sk
sk sl
sl uk
uk vi
vi et
et hu
hu th
th tr
tr fa
fa ms
ms hy
hy ka
ka ur
ur bn
bn mn
mn ta
ta kk
kk uz
uz ku
ku
load cell connection diagram
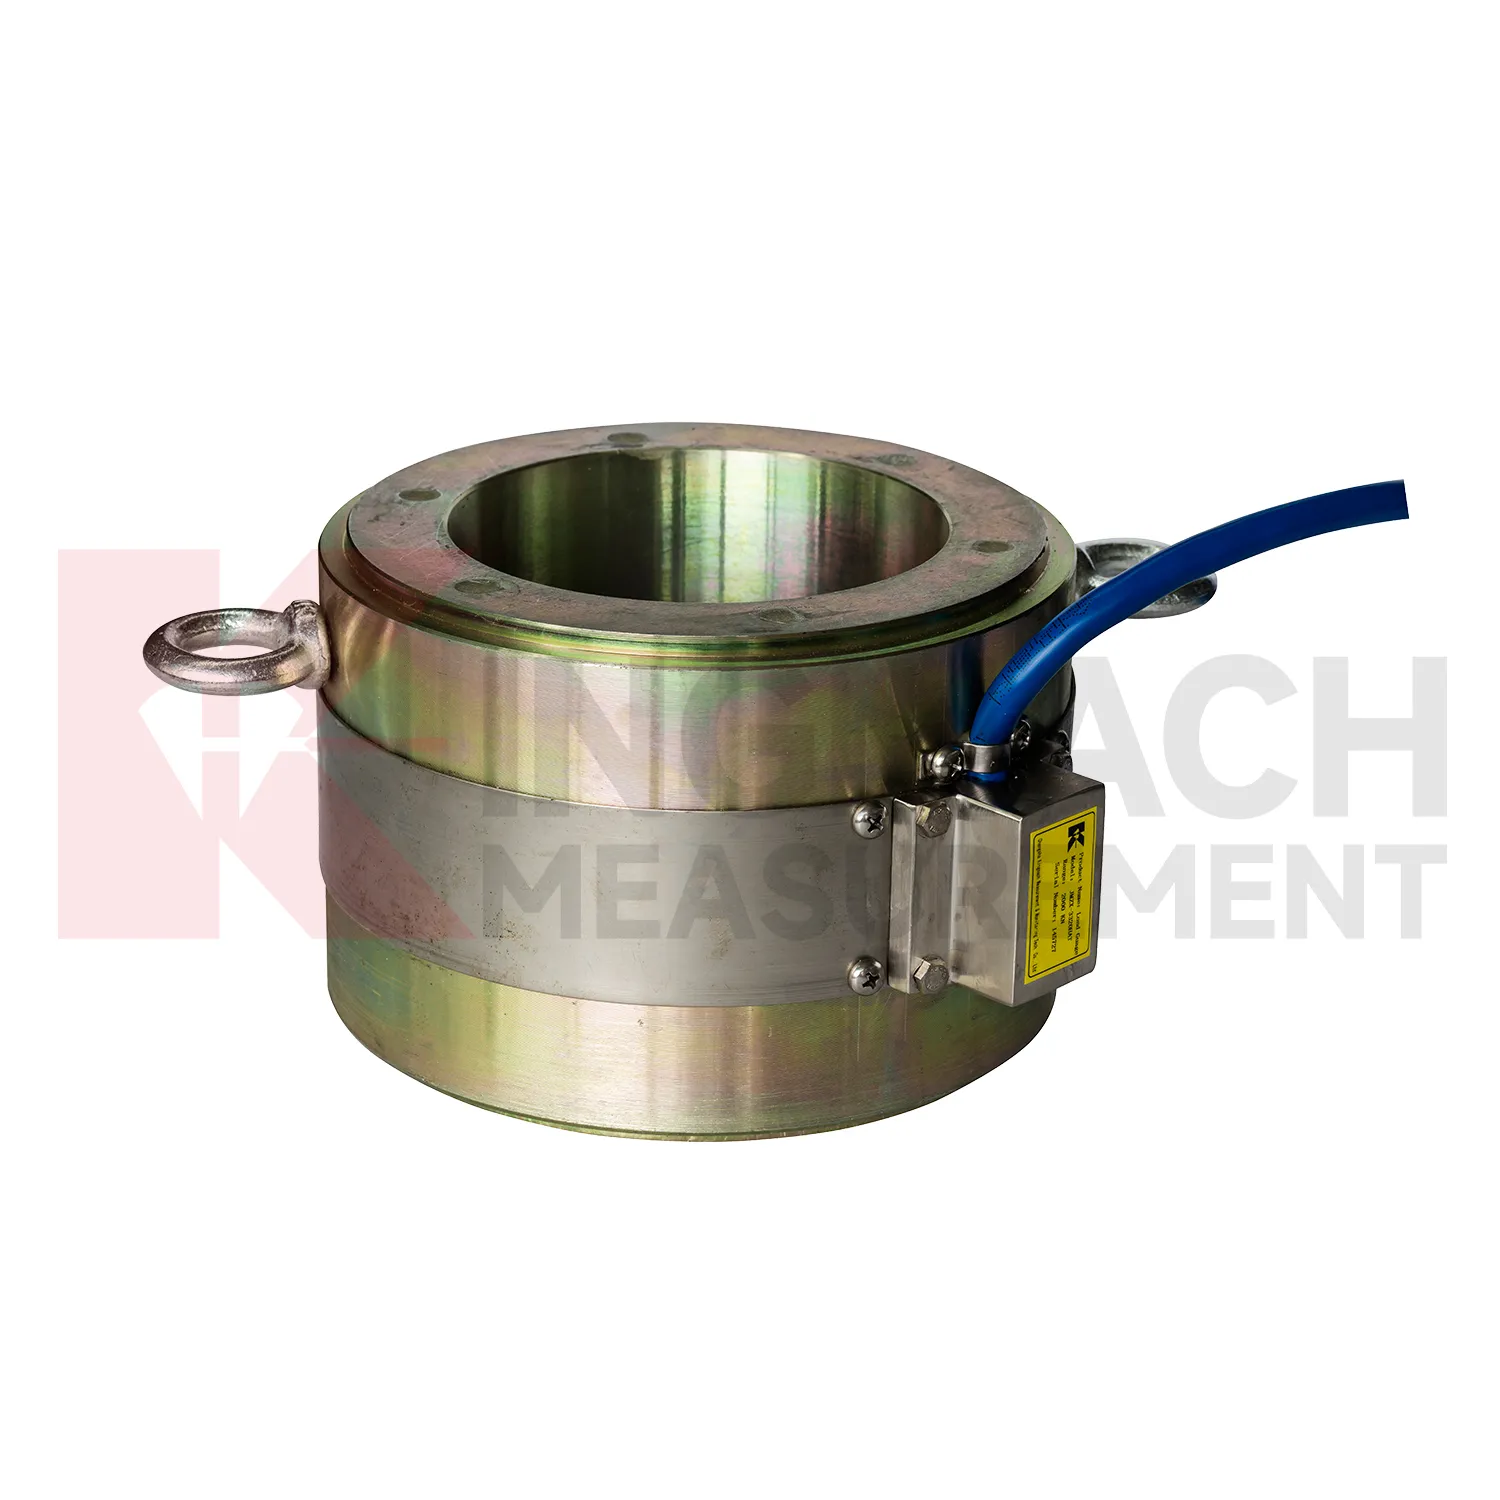
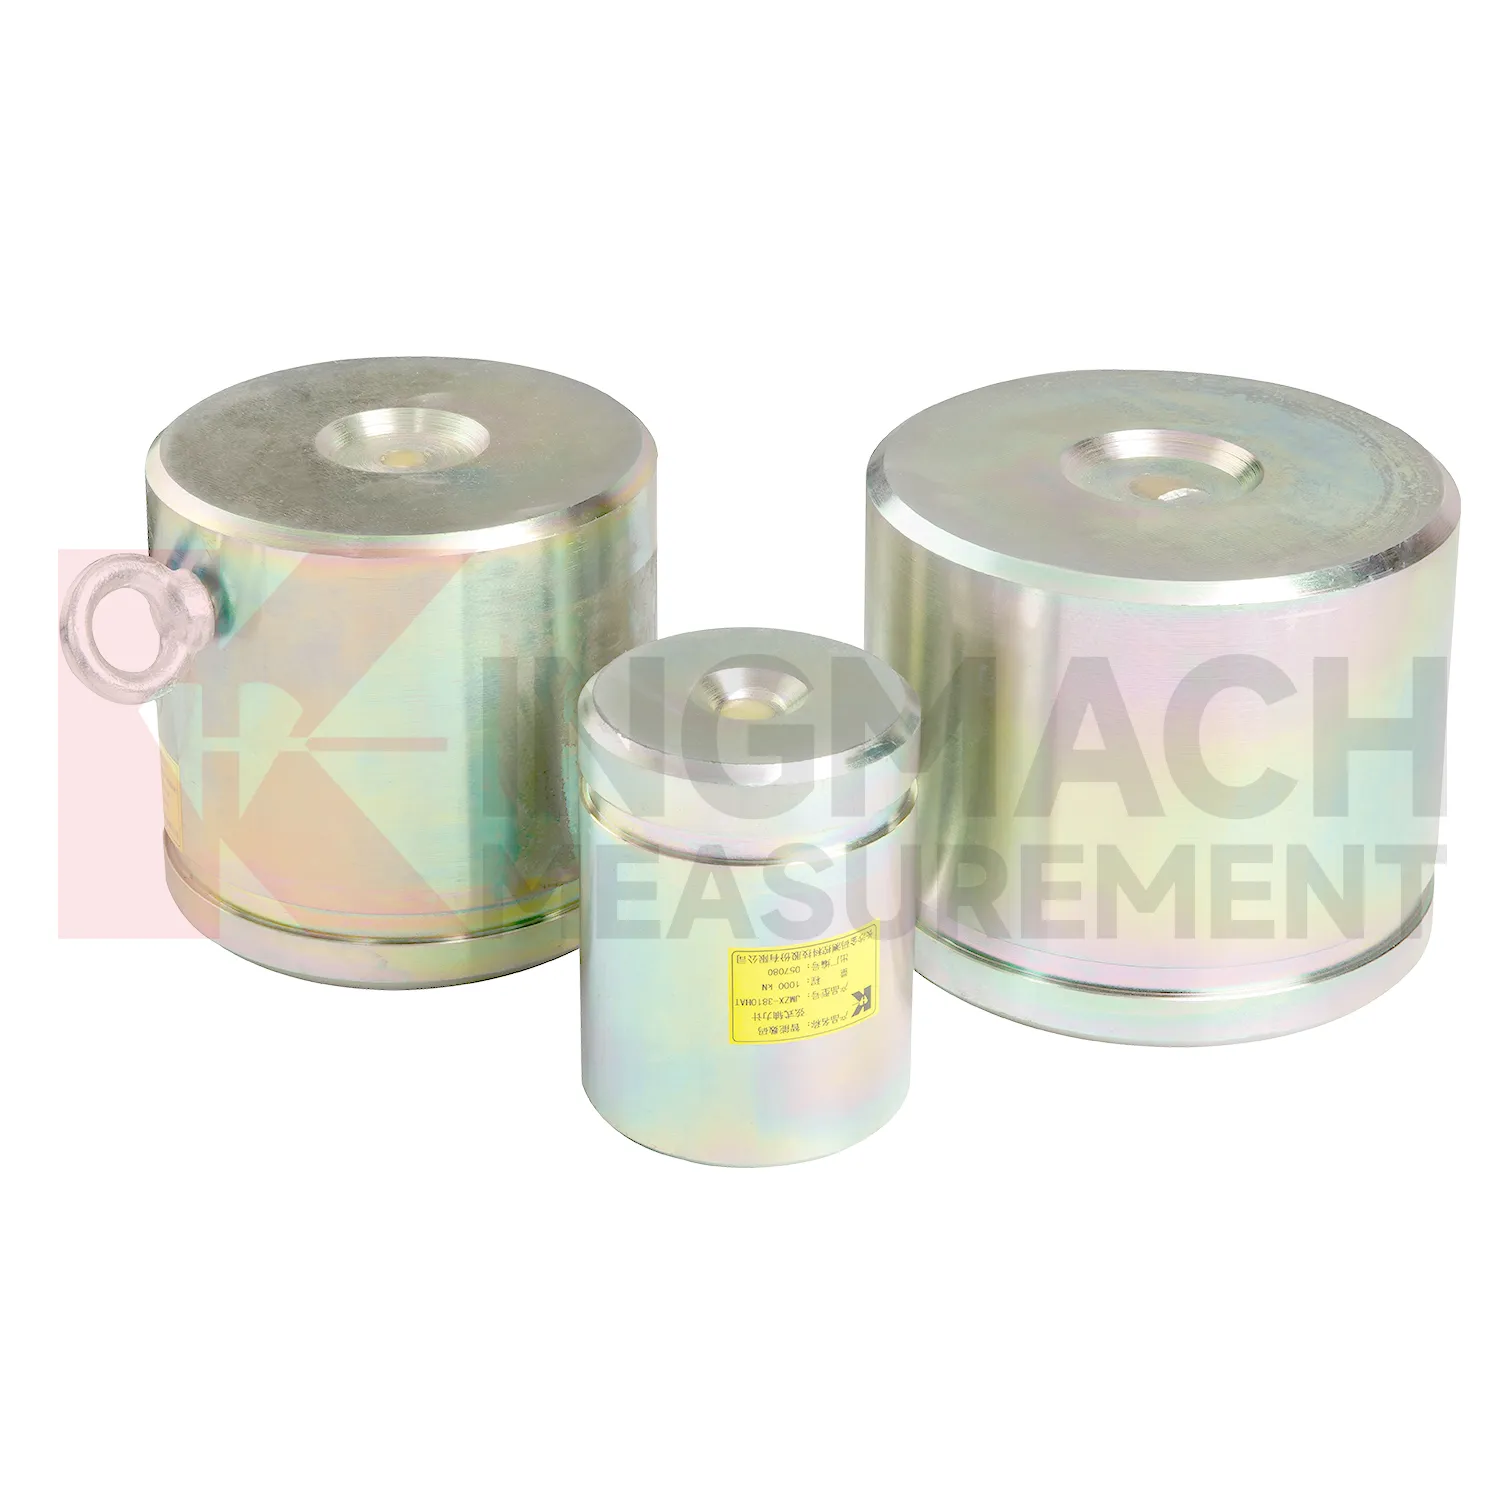
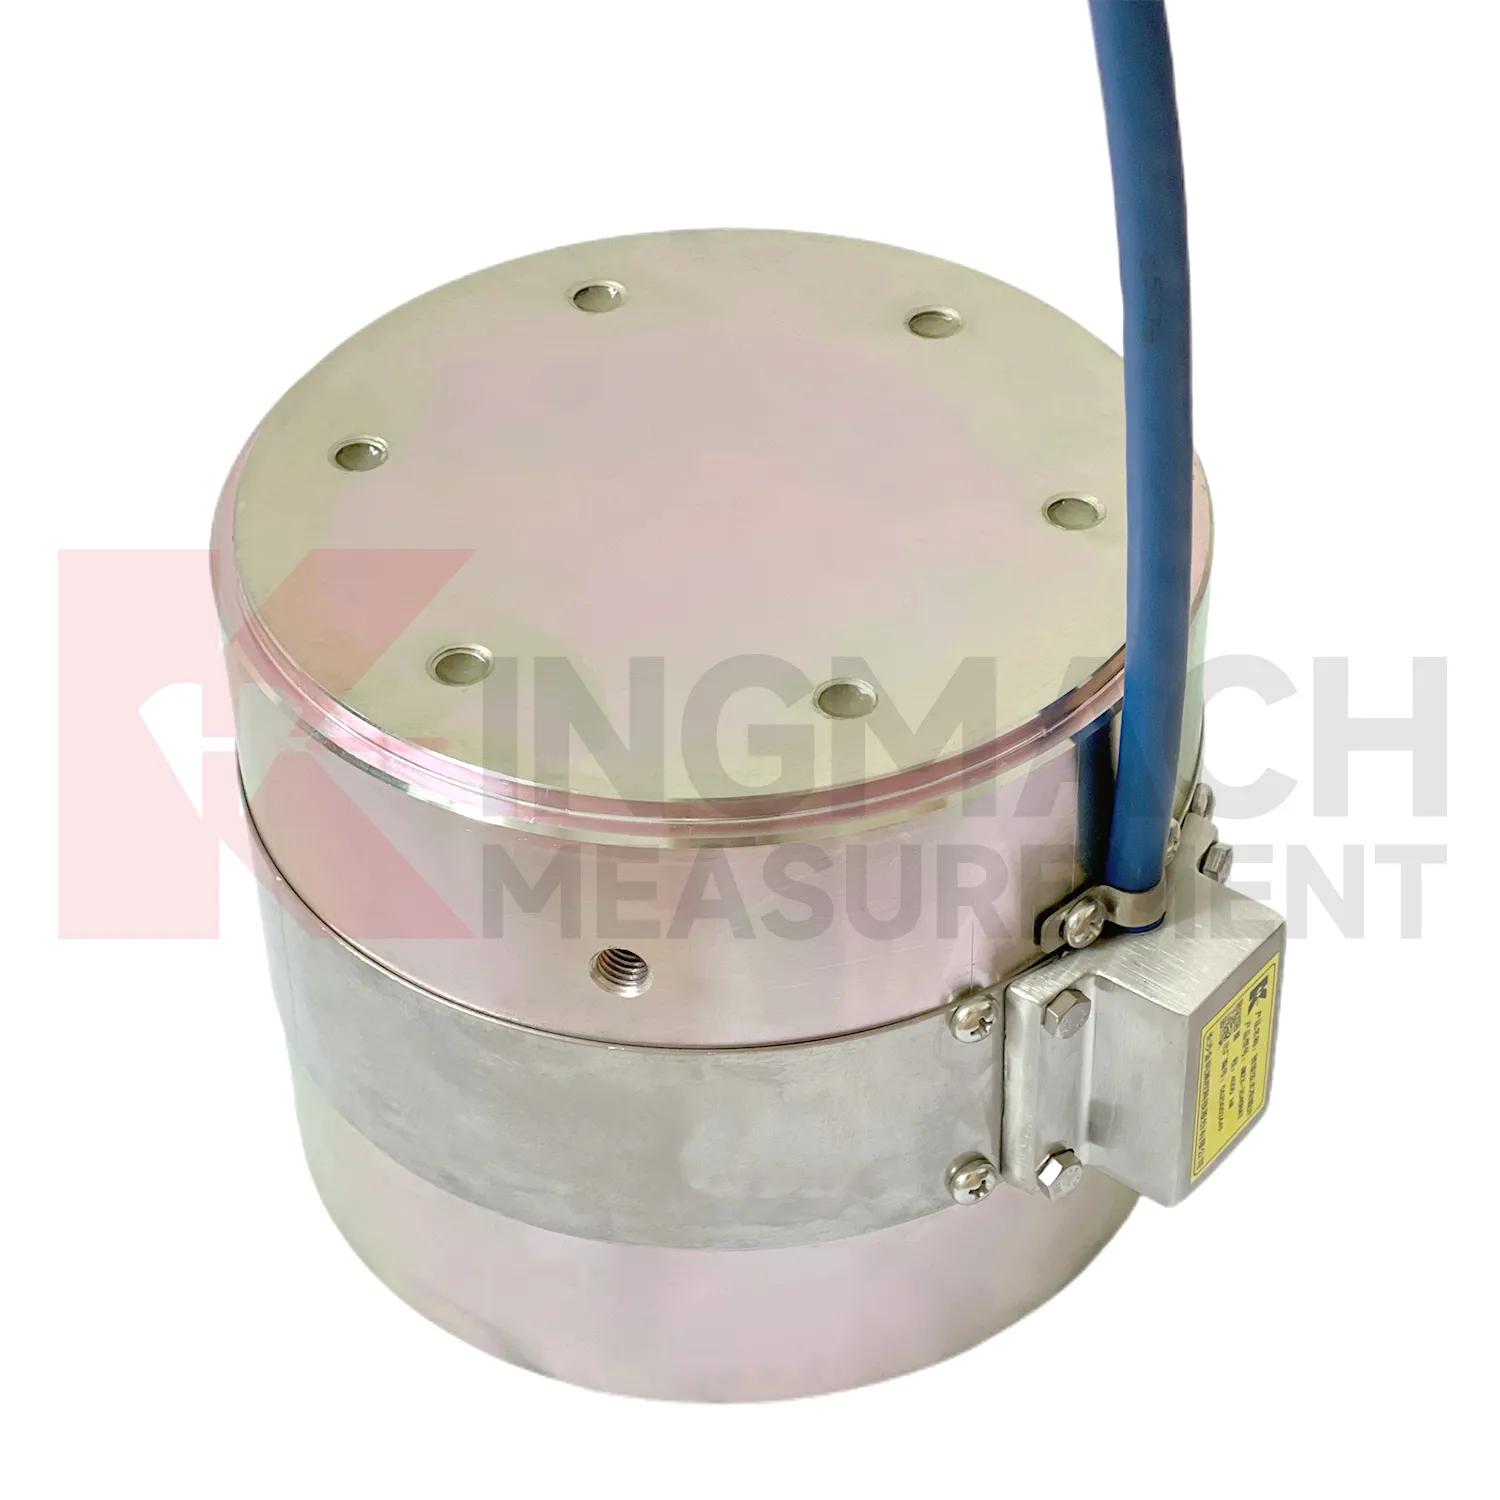
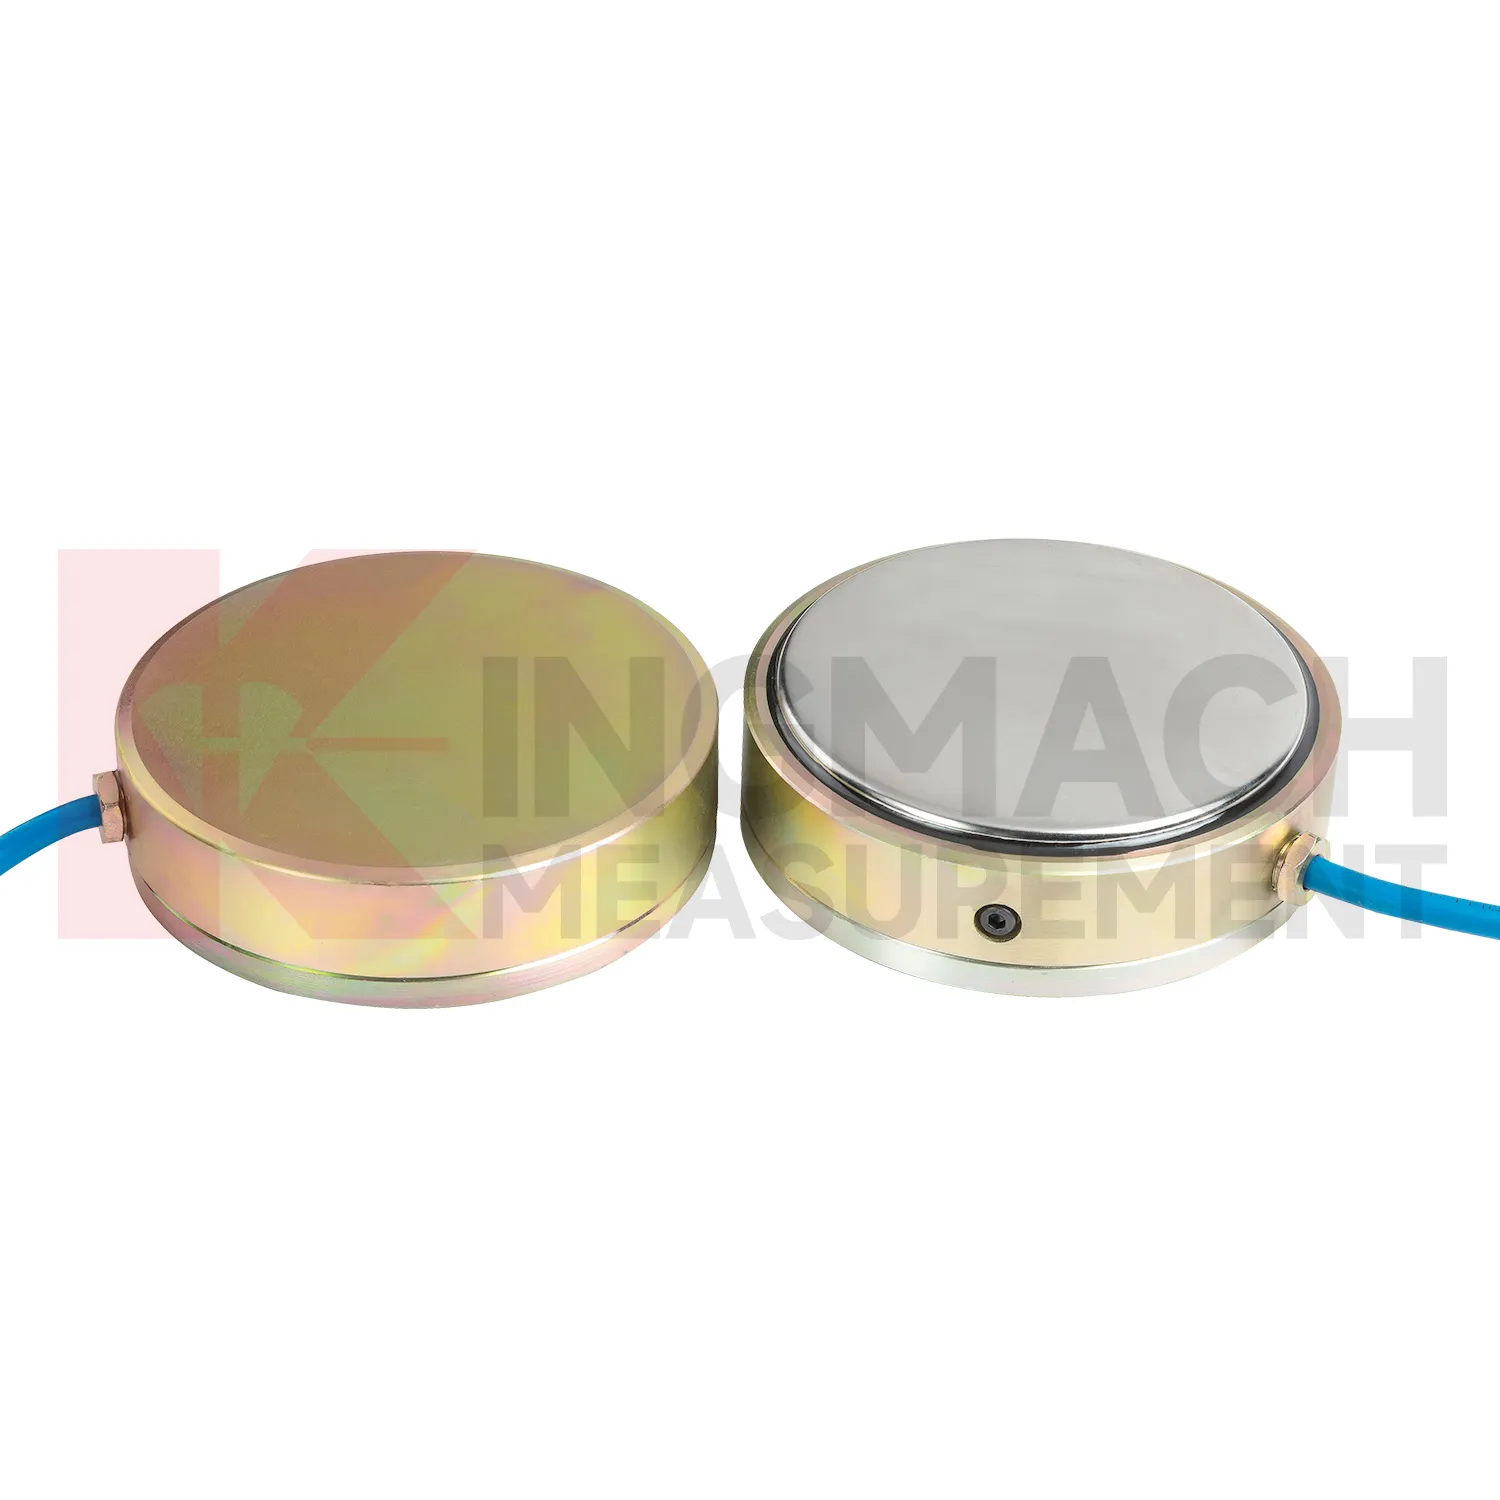
Kingmach load cell connection diagram products give engineers several ways to measure load depending on the contact condition. Hollow load cells fit cable and anchor force work, solid load cells fit compression and bearing capacity checks, axial force meters fit steel support monitoring, and earth pressure cells fit soil or contact pressure measurement. The listed technical span is broad: 500 kN to 8000 kN for hollow models, 1000 kN to 10000 kN for solid models, 200 kN to 3000 kN for axial force meters, and 0.3 MPa to 8 MPa for earth pressure cells. Accuracy and resolution are also stated in the product files, including 0.5%FS precision on main force models and 0.001 MPa resolution for pressure cells. Kingmach adds practical field features such as waterproofing, temperature correction, memory storage, digital output, and compatible readout instruments. A good specification compares these numbers with the design load, possible overload, installation surface, service environment, and planned inspection interval. This brand context fits projects that combine several monitoring categories rather than one isolated load point. A bridge or foundation pit may require force, settlement, displacement, water pressure, and software records in the same maintenance file, so compatibility should be reviewed early. The data record should also state whether the pressure or force point will be checked manually, automatically, or by both methods during handover.
Application of load cell connection diagram
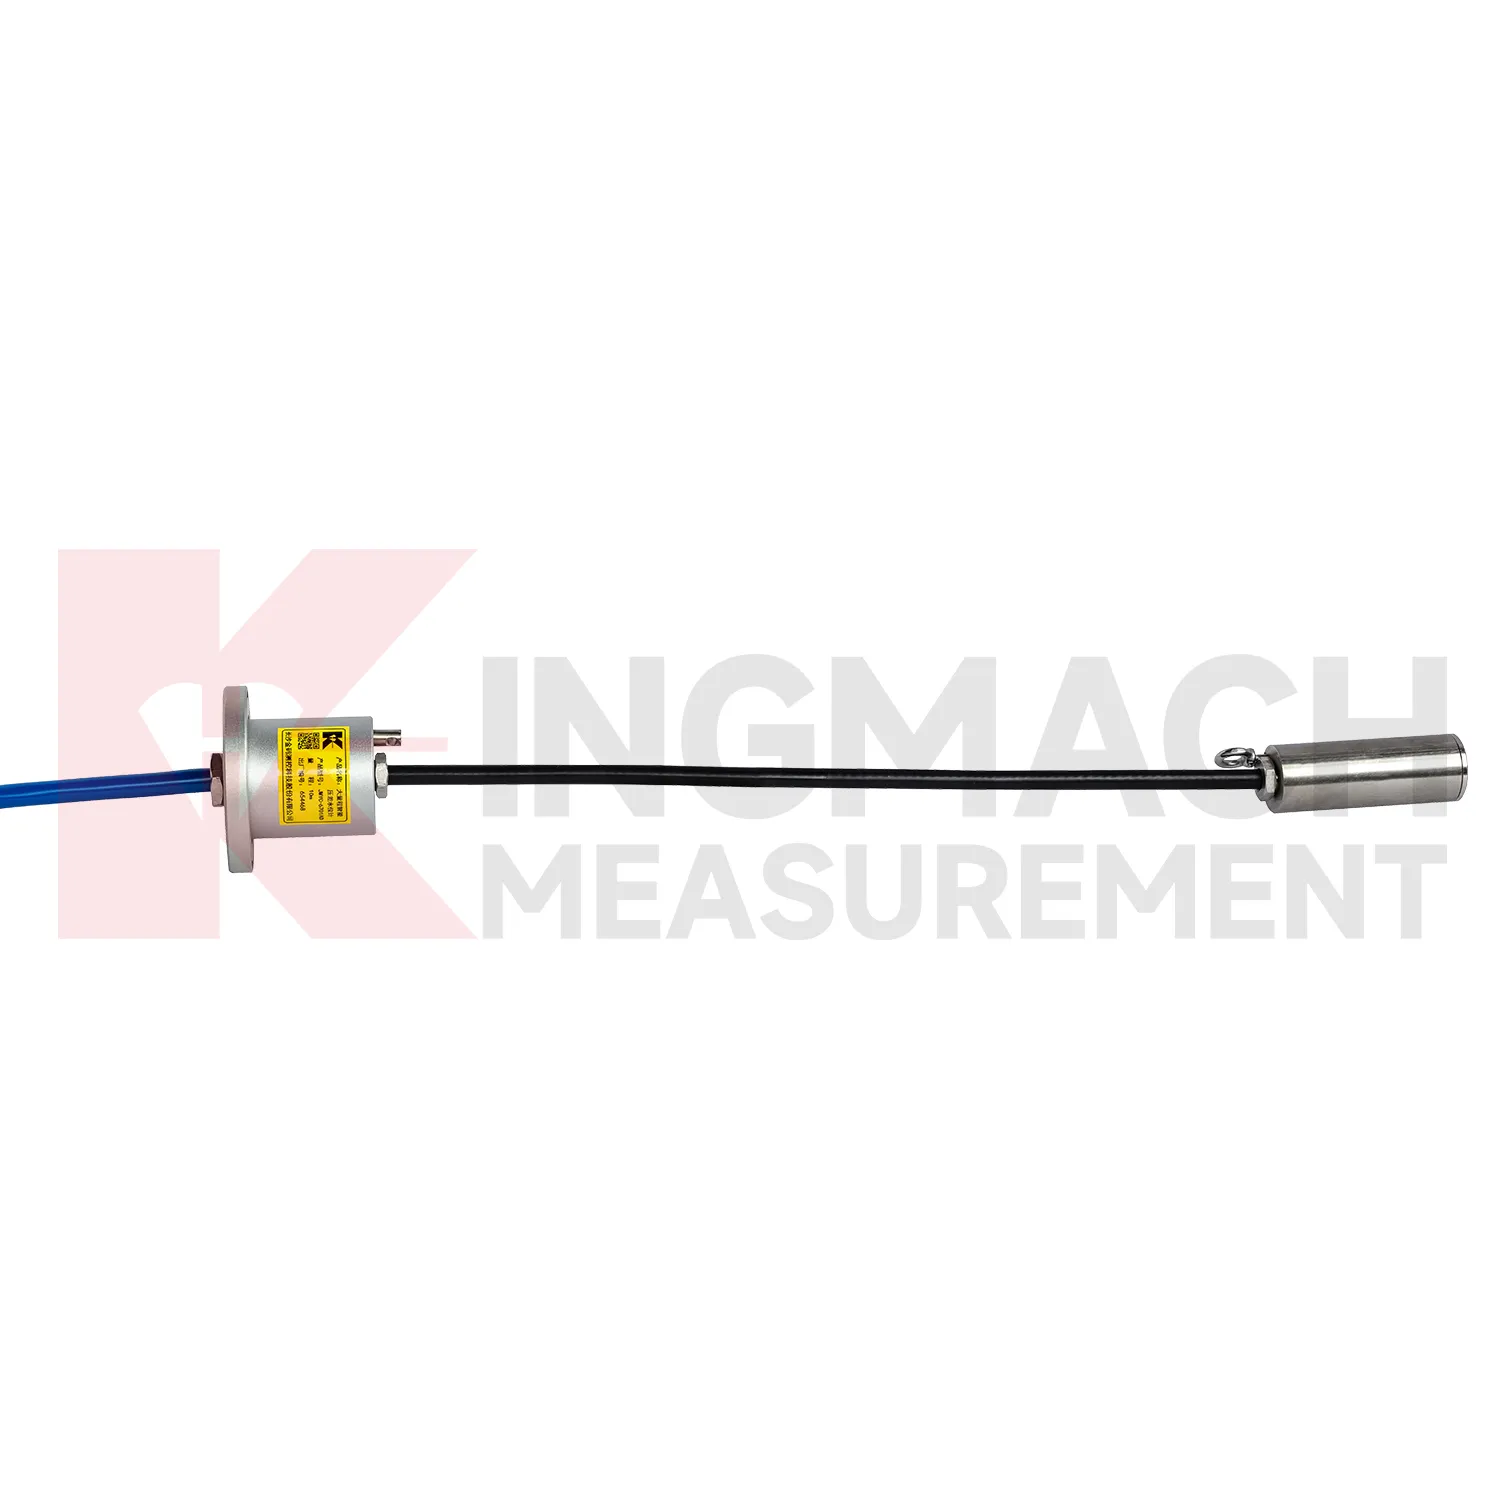
In pile load testing and bearing capacity verification, load cell connection diagram helps track applied force, load stages, unloading response, and residual behavior. The common problem is uncertainty around whether the applied load is centered and whether the recorded value matches the actual force passing through the test system. Kingmach solid load cells such as JMZX-35XXHAT list 1000 kN to 10000 kN ranges, 0.1 kN resolution, and 0.5%FS precision, with overload information listed as 20 to 50%F.S. range overload and 300 to 400%F.S. failure overload. These figures suit heavy test work when capacity margin must be checked before the sensor is installed. During the test, the record should include each loading step, hold time, unloading step, zero check, temperature, and any change to the bearing arrangement. Pairing the load record with settlement readings gives a clearer view of pile response. After the test, the documented calibration coefficient and instrument identity help keep the acceptance file defensible. Test reports should also record jack pressure, settlement response, load rate, hold duration, and any adjustment to the reaction system. These records help engineers identify whether an unusual load value came from the pile, the loading setup, or the measurement chain.
The future of load cell connection diagram
Future load cell connection diagram networks will need better alarm logic than fixed thresholds alone. A 5 percent force rise may be routine during concrete curing, serious during anchor relaxation, or irrelevant during a temperature swing. Kingmach products with temperature correction, stored records, digital output, and compatible data acquisition provide the raw structure for richer judgment. The next technical path is multi-parameter comparison: force plus displacement, pressure plus water level, support load plus excavation stage, cable force plus temperature. AI analysis can help rank unusual patterns, but the field team still needs plain evidence: which point changed, how fast, under what condition, and whether nearby sensors agree. Digital twin platforms can make that easier when sensor locations and calibration data are reliable. As monitoring specifications become more demanding, the instruments that win trust will be the ones that keep readings traceable from installation through maintenance, not just during the first acceptance test. Good metadata will matter as much as communication speed.
Care & Maintenance of load cell connection diagram
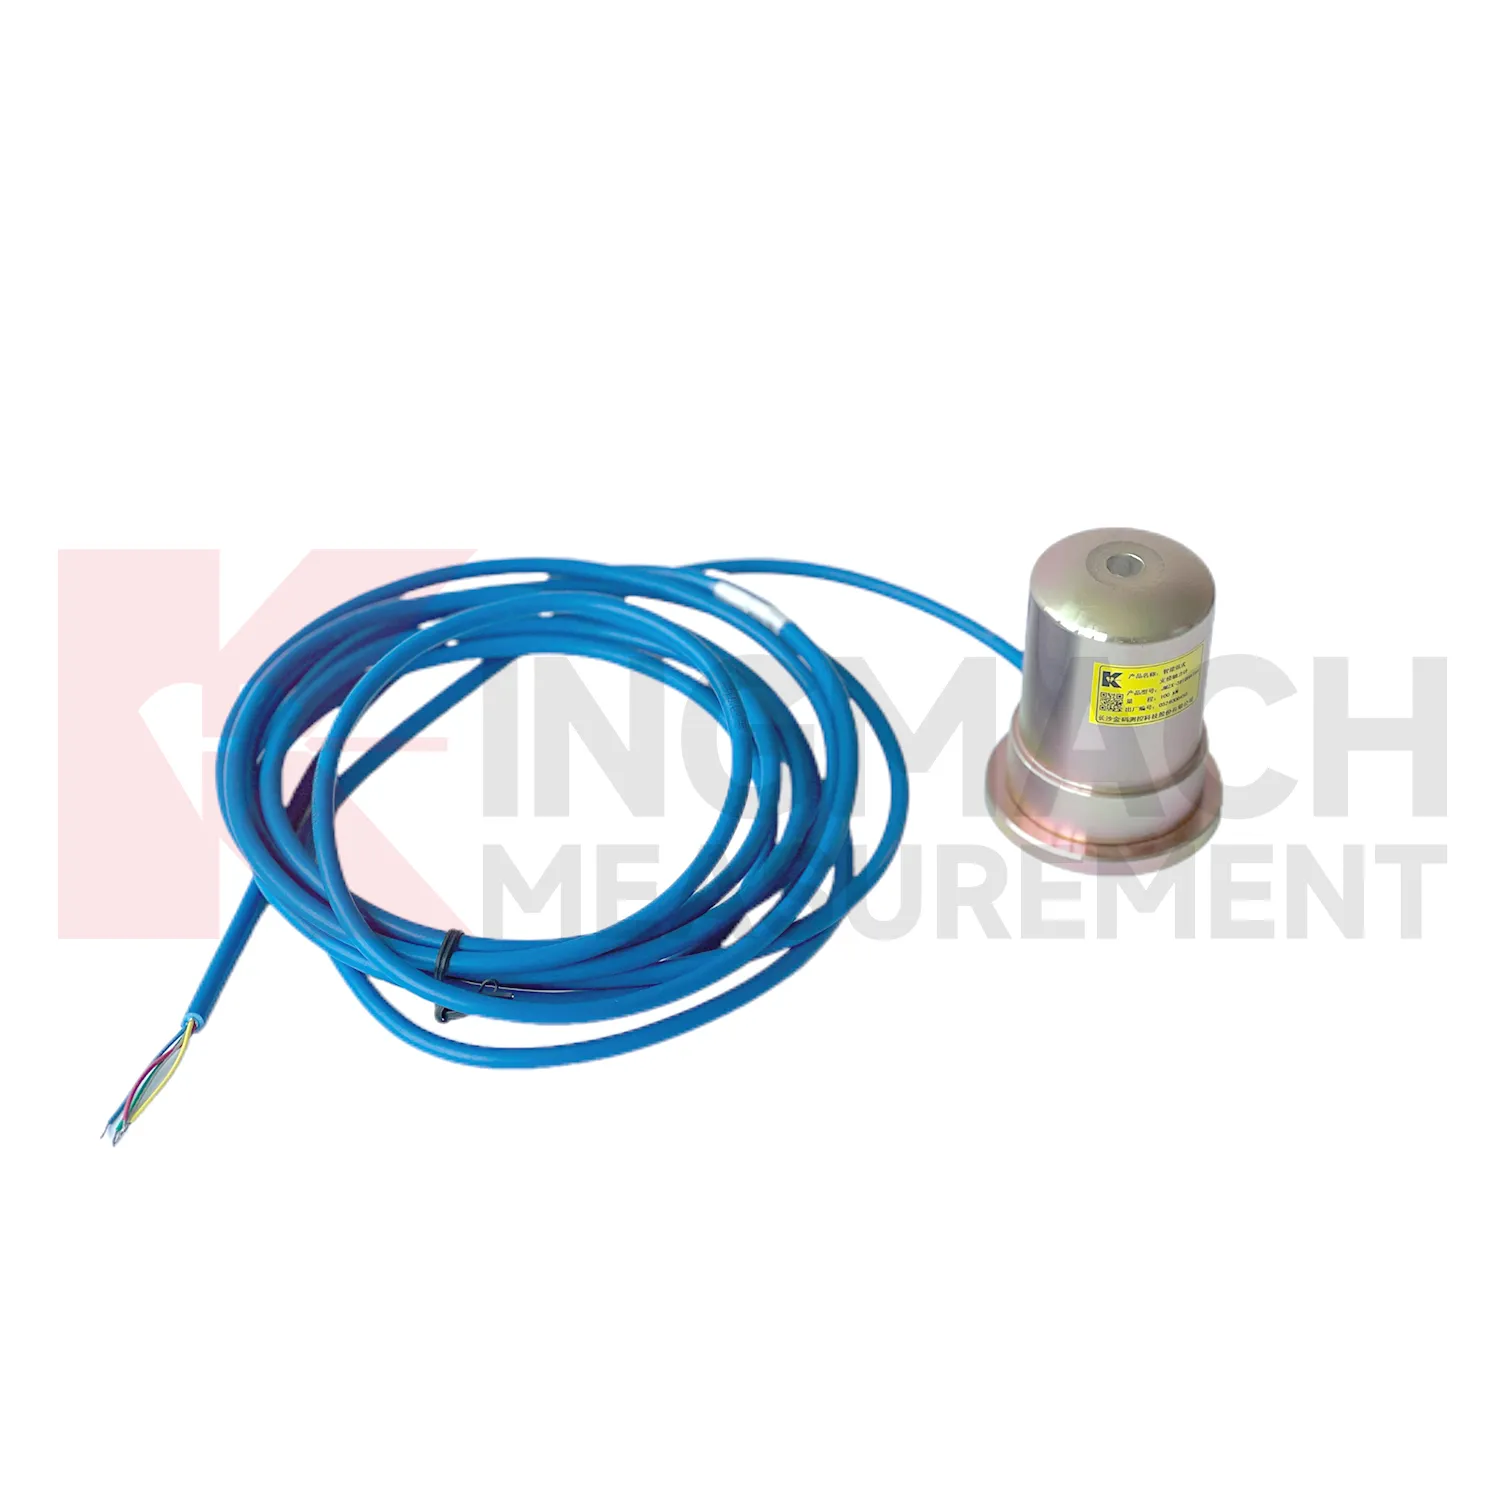
For load cell connection diagram used with manual readouts, care depends on repeatable procedure. Before installation, store the calibration sheet with the instrument and confirm that the readout supports the sensor type. Kingmach product pages mention compatible readouts and comprehensive vibrating wire instruments, which can display force values directly on selected models. During installation, label the cable and channel clearly, record the zero value, and protect the connection point from water and pulling. During each reading round, use the same unit, readout setting, point name, and observation sequence. Note temperature, weather, construction activity, and any visible damage near the sensor. Long term maintenance should include connector cleaning, cable jacket inspection, comparison with nearby points, and periodic calibration planning according to project requirements. If a reading seems wrong, repeat it after checking the cable and readout battery. Many apparent sensor faults come from swapped channels, loose connectors, or missing zero records. Use the same readout settings.
Kingmach load cell connection diagram
load cell connection diagram becomes most useful when the project treats it as part of a measurement chain. The chain starts with model selection and calibration, continues through surface preparation, installation, cable protection, readout setup, and first stable reading, then carries on through reporting and maintenance. Kingmach's range includes products with high capacity force measurement, waterproof construction, smart memory, direct kN display, and compatibility with readouts and automated acquisition systems. Those features only pay off when the field record is disciplined. The sensor should be named consistently, protected from mechanical damage, checked after loading events, and compared with nearby monitoring points. A force value that appears unusual should not be accepted or rejected in isolation. It should be checked against temperature, recent work, cable condition, connector sealing, and the last normal trend before a conclusion is made. That same record can later support warranty review, acceptance files, and maintenance planning. This is especially useful when the same point moves from construction control into long term asset monitoring.
FAQ
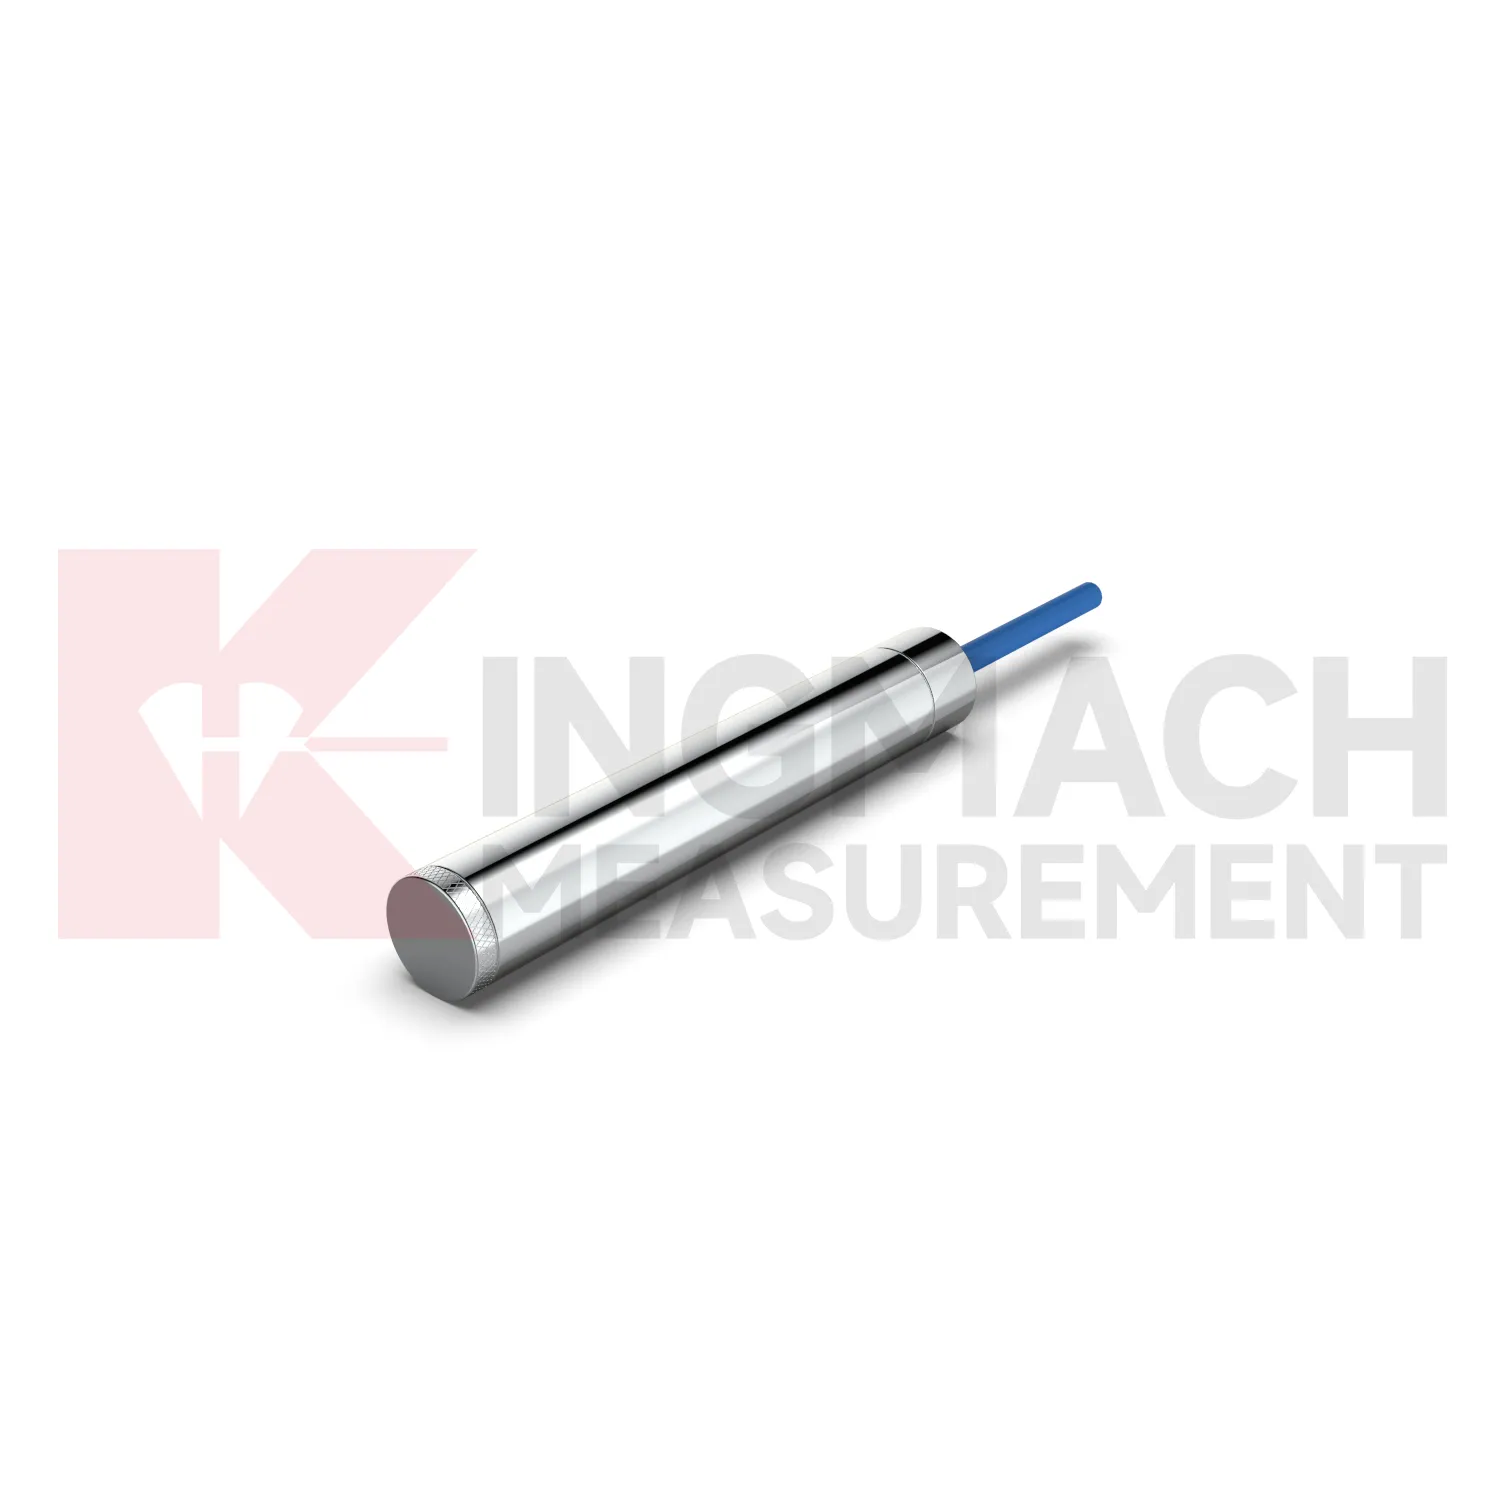
Q: What does load cell connection diagram do in a foundation pit or tunnel? A: It measures axial force in steel supports, anchor load, or pressure change as excavation and support stages progress. Q: Which Kingmach model fits steel support axial force? A: The JMZX-38XXHAT axial force meter is listed from 200 kN to 3000 kN, with 0.1 kN or 1 kN sensitivity and 0.5%FS accuracy. Q: Is it suitable for wet underground sites? A: The axial force meter lists a 1 MPa waterproof rating, but connector sealing and cable routing still need inspection. Q: Why is direct kN display useful? A: It reduces confusion because teams can read axial force directly instead of converting vibrating wire frequency on site. Q: What should trigger extra checks? A: Excavation step changes, rainfall, dewatering, support adjustment, sudden force jumps, or unstable channels.
Reviews
Robert Taylor
The weir flow meter is well-built and delivers accurate measurements. Great value for water management applications.
James Thompson
The tiltmeters and accelerometers are very sensitive and provide precise data. Perfect for our structural health monitoring system.
Latest Inquiries
To protect the privacy of our buyers, only public service email domains like Gmail, Yahoo, and MSN will be displayed. Additionally, only a limited portion of the inquiry content will be shown.
Amelia***@gmail.comSingapore
Hello, I am looking for visualization software for monitoring system data analysis. Please let me kn...
Olivia***@gmail.comUnited States
Hello, we are currently sourcing high-precision strain gauges and load cells for a bridge monitoring...